Archive for March 2024

New Home Construction Soars In February

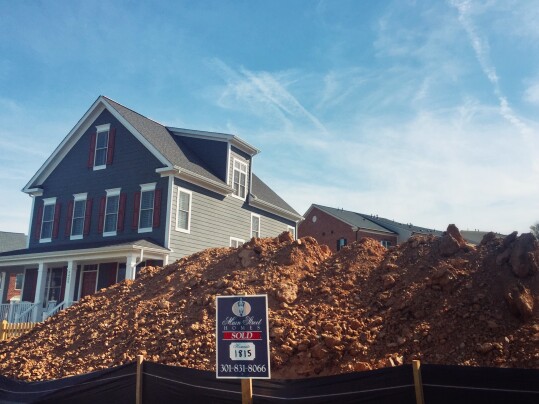
The market for newly built homes continues to benefit from the lack of older homes available for sale. Existing home inventory is lower than normal and buyers are increasingly looking at new construction as an alternative. This has been good for the new home market. It’s also led to a spike in construction activity. In fact, according to newly released numbers from the U.S. Census Bureau and the Department of Housing and Urban Development, the number of new homes that began construction in February was 10.7 percent higher than the month before and almost 6 percent higher than last year at the same time. Similarly, the number of new homes completed in February rose almost 20 percent. The news comes at the same time home builders are expressing rising confidence in the market, according to recent survey results – a sign that builders see more gains on the way. (source)

Builders Express Rising Confidence In Market

Home builders can be a pretty good gauge of where the housing market is headed. Because their business depends on knowing where and when buyers are looking to purchase a home, they’re generally good at reading market dynamics. That’s why the National Association of Home Builders keeps a monthly measure of builder confidence. If builders are optimistic and building more homes, it’s likely the overall market is in good shape. The NAHB’s Housing Market Index measures builder confidence on a scale where any number above 50 indicates that more builders view conditions as good than poor. In March, it rose three points to 51. It was the fourth consecutive monthly gain and the first time since last July that it’s been over 50. Carl Harris, NAHB’s chairman, says buyers are ready to move. “Buyer demand remains brisk and we expect more consumers to jump off the sidelines and into the marketplace if mortgage rates continue to fall later this year,” Harris said. (source)

How Affordable Is Buying A Home In Today’s Market?

Calculating whether or not you can afford to buy a house means examining your budget, spending habits, and how a mortgage payment might fit into your monthly expenses. Ultimately, it’s a calculation only you can make. After all, you’re the best judge of how much you’re comfortable spending. Still, there are several ways to get a sense of overall affordability conditions and how expensive it is to buy in today’s market. The National Association of Realtors’ Housing Affordability Index is among them and, according to the most recent numbers, the typical family can still afford to buy a median-priced home. The index – scored on a scale where any number above 100 indicates that a family with a median income can afford to buy – is currently at 101.9 nationally. That means, though conditions are tight, they’re still manageable. But like anything else, where you’re buying has a significant impact. For example, the index component measuring affordability in the Midwest scored 143.9, well above 100. The West, on the other hand, has a score of 75.5. The South and Northeast both scored just over 100. (source)

Is ‘Rate Lock’ Beginning To Ease?

The inventory of homes for sale has been lower than normal for years now. There are a number of reasons for this. One factor keeping inventory low is the number of homeowners who refinanced their loan when mortgage rates were at historic lows and, having locked in a low rate, are reluctant to move. But according to newly released numbers, there may be evidence that the “rate lock” that made potential sellers hesitant to list their homes has begun to ease. How so? Well, new listings of existing homes rose 21 percent in February compared to year-before levels and were up 20 percent from the month before. The improvement is a sign sellers are more active heading into this spring’s sales season. The gains have been significant and widespread. In fact, inventory was up in each of the 50 largest U.S. metro areas, with the strongest increases seen in Texas and Florida. Overall, the inventory of homes for sale is now up 12 percent nationally compared to last year. This is encouraging news and evidence that homeowners may be increasingly willing to make a move. (source)

Average Mortgage Rates Fall Week-Over-Week

According to the Mortgage Bankers Association’s Weekly Applications Survey, average mortgage rates fell last week from the week before. Rates were down across most loan categories, including 30-year fixed-rate loans with both conforming and jumbo balances, loans backed by the Federal Housing Administration, and 15-year fixed-rate loans. Mike Fratantoni, MBA’s senior vice president and chief economist, says economic data was behind the improvement. “Mortgage rates dropped … last week for most loan types because of incoming economic data showing a weaker service sector and a less robust job market, with an increase in the unemployment rate and downward revisions to job growth in prior months,” Fratantoni said. Declining rates helped boost demand for mortgage applications, which rose 7.1 percent from the week before. The improvement included a 5 percent increase in demand from home buyers. The MBA’s weekly survey has been conducted since 1990 and covers 75 percent of all retail residential mortgage applications. (source)

Mortgage Credit Availability Sees Improvement

Lending standards aren’t fixed. That means qualifying for a mortgage can be easier – or more difficult – depending on when you’re applying for a loan. That’s why the Mortgage Bankers Association keeps a monthly measure of mortgage credit availability. Its Mortgage Credit Availability Index measures whether standards are loosening or tightening on a scale where any increase means it has gotten easier for borrowers to get a loan. According to the most recent index, access to mortgage credit improved in February, though the improvement was small. In fact, the index rose less than 1 percent. Joel Kan, MBA’s vice president and deputy chief economist, says credit remains tighter than usual. “Mortgage credit availability remains quite tight – near the lowest levels in MBA’s survey – even as application volume lags last year’s pace and as the industry continues to reduce capacity,” Kan said. (source)

Where Are The Country’s Most Stable Markets?

A new report from ATTOM Data Solutions looks at county-level housing markets across the country in an effort to determine which are the most stable and which face rising risks. The analysis was based on a number of factors including the percentage of homes facing foreclosure, the portion with loan balances that exceeded property values, percentage of local wages necessary to cover homeownership expenses, and local unemployment rates. The results show the country’s most stable markets located primarily in the South and Midwest – with Wisconsin leading the list with nine of the strongest markets. More vulnerable markets were located primarily in the areas around New York City, the Chicago metro area, and inland California. Rob Barber, ATTOM’s CEO, says the housing market remains strong overall. “As always, this is not a warning sign for homeowners to run out and sell, or rush to buy, in any specific market,” Barber said about the results. “The housing market remains strong throughout most of the country despite some recent small downturns.” (source)